


Strategies For Growing Income In 2025

Growing income remains one of the hallmarks of successful income investing. In this Part 2 follow-up article we discuss sustainable strategies for growing income. Take a look at Part 1 for strategies that, while popular, are unlikely to match investor expectations and goals. We also highlight some of our picks for each associated strategy.
1. Take Short-Term Rates Into Account
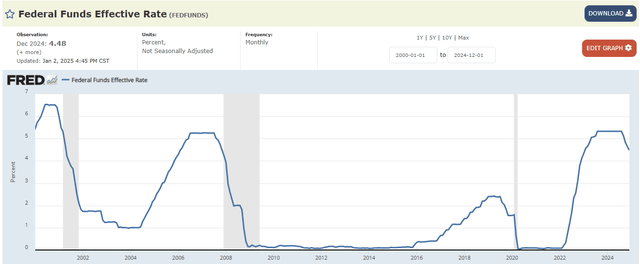
The first strategy is simply aligning portfolio allocation in the direction of short-term rates. As the following chart shows, unlike nearly all other assets, short-term rates tend to trend monotonically over extended periods of time. This is clearly linked to the fact that Fed policy is tilted in a certain direction while moving incrementally. The Fed manages their cutting and hiking cycle gradually given the old adage of monetary policy working with "long and variable lags" and the overall uncertainty of how monetary policy is impacting the economy.
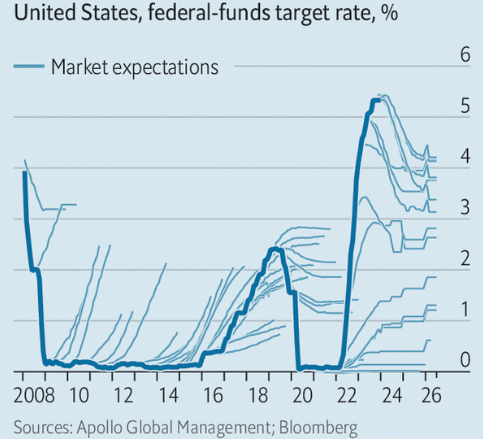
That said, this strategy is not a prescription for loading up on floating-rate assets during hiking cycles and fully rotating out during cutting cycles. Markets often get ahead of themselves both in terms of the timing and the size of the rate changes. For example, last year the market expected the terminal Fed Funds rate to reach 2.75% while now it expects it to remain above 4%.
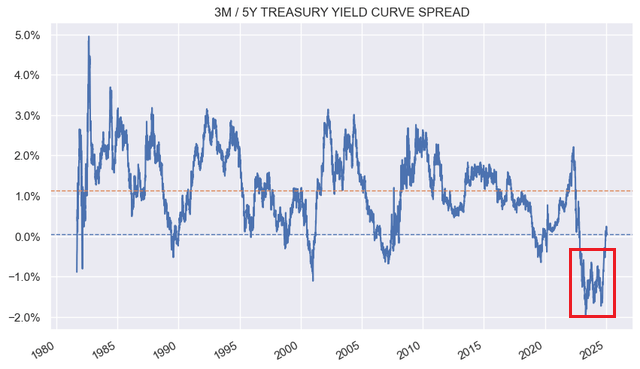
Another key point is that investors should take the shape of the yield curve into account. Until recently the 3-month / 5-year yield curve has been inverted and has only disinverted recently, several months after the Fed kicked off the cutting cycle. This meant that there was no need to ditch floating-rate assets as they still offered a pick-up over their fixed-rate counterparts - a theme we have been highlighting consistently.
If longer-term rates move higher or short-term rates move lower (a big if according to some analysts) then a switch could be in order. Moving too early can be costly as many investors found out who made the rotation to duration assets in September - when the Fed made its first cut. 10Y Treasury yields have risen by 1% since then, delivering costly capital losses to bonds.
Once the yield curve disinverts significantly, we will likely increase our allocation to fixed-rate preferreds such as WFC.PR.L, BAC.PR.L as well as Municipal bonds, particularly across unleveraged CEFs like EIM. And if the yield curve moves to a 1.5-2% level, then leveraged bond CEFs will be significantly more appealing, particularly if spreads move higher as well.
2. Keep An Eye On Resets
Preferreds investors are well aware that many shares switch to a floating-rate on their first call date, unless redeemed. Because today's short-term rates are relatively high in historical terms, the floating-rate coupons of most individual preferreds are well above their previous fixed-rate levels.
For example, the chart below shows some of the coupon levels in the mREIT preferreds sector. Because of this elevated level of short-term rates, it can make a lot of sense to switch into preferreds that will reset to a floating rate. Sure, some of them will be redeemed however many will not. In fact, most preferreds in the mREIT sector have not been redeemed but have happily continued to pay a significantly higher dividend over their previous level.
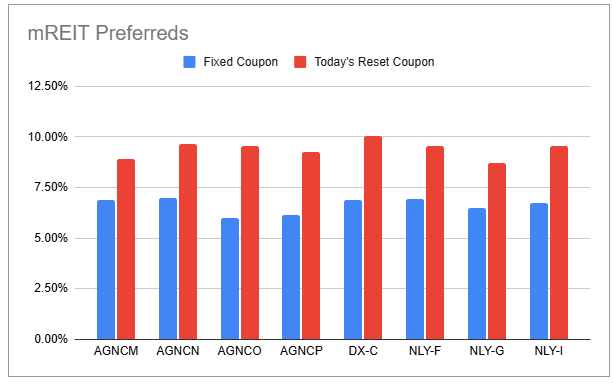
We are keeping an eye on both AGNCP and DX.PR.C. Both stocks will move to a high single-digit yield in April if they are not redeemed. AGNCP is trading below par and, thus, has no call price risk. DX.PR.C is slightly over "par" but not significantly so. Investors should look for an announcement in mid-March to see if DX.PR.C will be redeemed. If there is no announcement, it will mark a good entry point for a 10% yield in what is the lowest-risk preferred in the mREIT sector in our view.
3. Risk Rotation
The more income investors pay attention to the market the more clearly they begin to see various regular market patterns. Three of these patters are particularly useful in managing investment allocations. The first is that credit markets oscillate in fairly predictable ways as the high-yield corporate credit spread chart shows below. Although the ultimate timing and extent of the oscillation is not forecastable, the chart clearly has a regular rhythm to it.
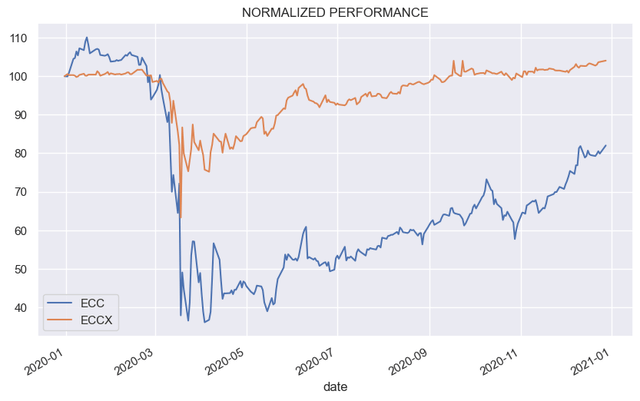
The second pattern is that lower-quality assets tend to fall more than higher-quality assets. To borrow a chart we have used before, we can see this in the performance differential during COVID between ECC common shares and an ECC bond (ECCX).
The third pattern is that during periods of strong risk appetite such as today, the marginal compensation for moving to lower quality assets shrinks. For example, today CCC-rated assets offer a below-average level of compensation over their BB-rated counterparts.
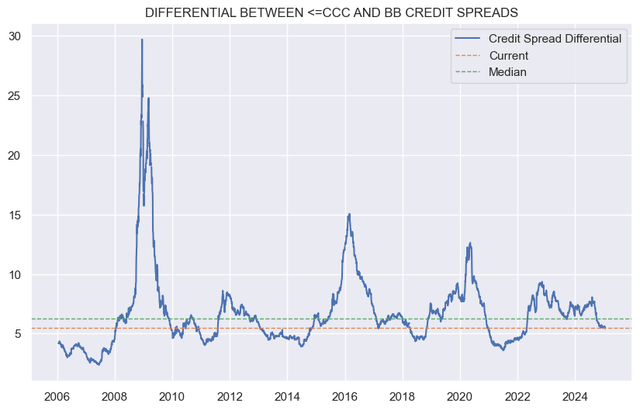
Given these three patterns and the fact that credit valuations are as tight as they have been historically suggests that there is likely more downside than upside risk for credit assets. It also means that the opportunity cost for moving up in quality is modest given lower-quality assets offer below-average levels of compensation over and above higher-quality assets.
All of this means that investors can clip decent yields while waiting for an opportunity to move back into higher-yielding assets. Unless "this time is different" this opportunity will surely come and will help investors to both sustainably boost the income on their portfolios and likely achieve some solid capital gains.
We like a number of baby bonds and higher-quality preferreds as our drier-powder allocation. The reason for these allocations is that they are higher up the capital structure than the common shares, are not explicitly leveraged (unlike leveraged funds) and have no discount dynamic. The lack of leverage means their value is not magnified by market moves and the discount dynamic means the price doesn't get a double whammy in a risk-off period.
Here we like bonds like the mREIT NYMT 9.125% 2029 bond (NYMTI) and the CEF OXLC 8.75% 2030 bond (OXLCI), trading at yields of 9.2% and 8.2% respectively.
4. Getting Paid On Leverage
One thing that most income investors will agree on is that you should get paid on your capital. It may come as a surprise that many investors are not getting paid a whole lot on up to a third (in some cases even more) of CEF assets.
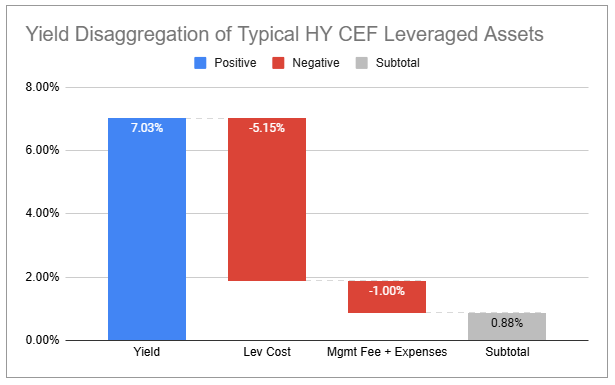
If we take a typical High Yield corporate bond CEF, the yield breakdown on its leveraged assets looks like the following (leveraged assets for a fund with 35% leverage make up a bit more than a third of its total assets).
What we see is that the fund earns around 7% on its assets (the yield on the high-yield corporate bond index), pays around 5.15% on its leverage and another 1% as management fees and expenses, leaving investors with a bit under 1%. However, once we factor in a historic average loss rate of 1.7% on HY corporate bonds, investors come out around -0.8%. In other words, investors pay roughly 0.8% per annum for the privilege of having exposure to a third of CEF assets in this example.
Obviously, every sector is different and individual CEF numbers will differ but that's the broad picture. What this means is that investors should critically evaluate their CEFs to see what they are actually earning on the fund's leveraged and unleveraged assets and whether leveraged exposure makes sense, particularly in a market that is objectively expensive i.e. where downside risk is higher than upside risk.
Clearly not all leveraged assets should be thrown overboard. Investors who expect capital gains can justifiably hold leveraged funds even if they receive little income compensation for the leveraged assets (because they expect capital gains).
Funds that have been able to lock in a low level of fixed-rate debt on the other hand, are highly attractive. The BDC Fidus Investment Corp (FDUS), for example, earns around 13.8% on its assets and has a leverage cost of just 4.5% - an extremely attractive proposition, particularly given its valuation until recently has often traded at a discount. The CLO Equity / Loan CEF (XFLT) pays around 6.5% on its leverage which is not too bad in the context of its portfolio yield of around 14%.
The key takeaway here is that investors ought to keep an eye on how much they are getting paid on their capital and whether that's sufficient for the underlying risk.
5. Relative Value Switches
Relative value switches are situations where investors rotate between very similar funds based on relative valuation. This strategy is particularly effective during drawdown periods (when capital gain implications are lower) or in tax-deferred accounts. Strong candidates for this strategy are CEFs of the same manager and preferreds from the same issuer.
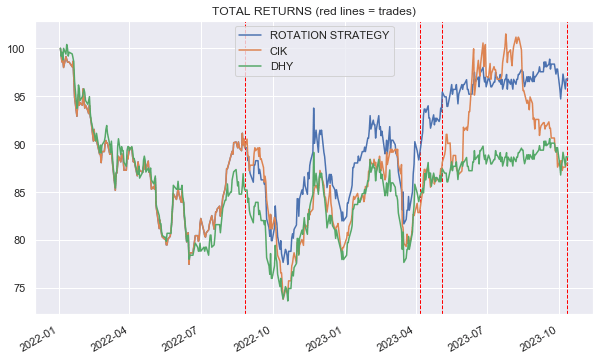
To illustrate how this works, once the pair of candidates is established, we track the discount differential between the two funds as shown below (or the yield differential between preferreds). Based on this historical relationship we rotate from one to the other.
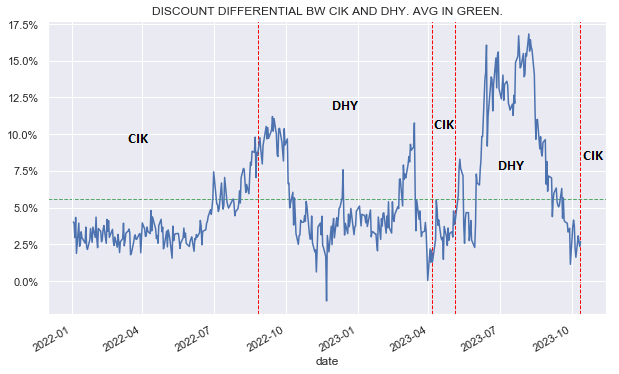
The performance for this individual pair, as is the case for most pairs, has exceeded the performance of the individual funds.
Over the last couple of years we have taken advantage of a number of these switches in the following pairs:
Credit Suisse high-yield corporate bond CEFs (CIK) and (DHY)
Cohen & Steers preferreds CEFs (LDP) and (PTA)
PIMCO credit CEFs (PDO) and (PAXS)
Annaly preferreds (NLY.PF), (NLY.PG), (NLY.PI)
Two Harbors preferreds (TWO.PA) and (TWO.PB)
NYMT preferreds (NYMTL), (NYMTM), (NYMTN), (NYMTZ)
This strategy of rotating across very similar securities is attractive as it not only locks in higher yields for nearly identical exposure but also provides an additional margin of safety in the process. To sum up this strategy consider the question "How do you pick the best security in a given sector". Our answer is "By picking a good pair of securities and rotating between them"
6. Tilt To Funds With Structural Advantages
One odd aspect about income investing is that many investors often focus on the flashy aspects of a given fund and ignore those elements that can truly deliver outperformance over the longer-term. The distribution rate does a lot of heavy lifting in how investors choose to position their portfolios despite the fact that it often has little bearing on the longer-term absolute or relative return of the fund.
Rather than chasing after the highest distribution rates, investors should focus on the key structural features that have a direct link to performance. This includes low fees, low leverage costs, robust leverage instruments, lack of leverage caps and other features.
In the BDC space we like GBDC which has the most shareholder-friendly fee structure with a 1% management fee, 15% incentive fee, an 8% incentive fee hurdle and a total return hurdle. This allows the company to take less risk to generate a similar level of return for investors as the rest of the BDC space.
In the CEF market, CIK has an unusually low fee structure, charging just 0.5% on the lower of the fund's market value and NAV. This works out to around 0.36% on total assets which is less than half of the average CEF (and about a third of many CEFs). We also like the Flaherty preferreds CEFs which have modest fees and no leverage cap, something that has hobbled the Nuveen preferred CEFs in the past, causing them to deleverage near drawdown bottoms, locking in economic losses. In the BDC space, BBDC has a relatively high incentive fee hurdle of 8.25% which will support net income if short-term rates overshoot to the downside.
It is these structural features, rather than the flashier yields, that support performance over the longer-term.
7. Take Advantage of Special Situations
There are several ways to generate outperformance in income, whether it's in a given security, asset class or overall. One way is to pick winners - a tough proposition as it turns out. An easier task is to keep an eye on special situations which very often provide reliable alpha on top of the underlying beta of the asset.
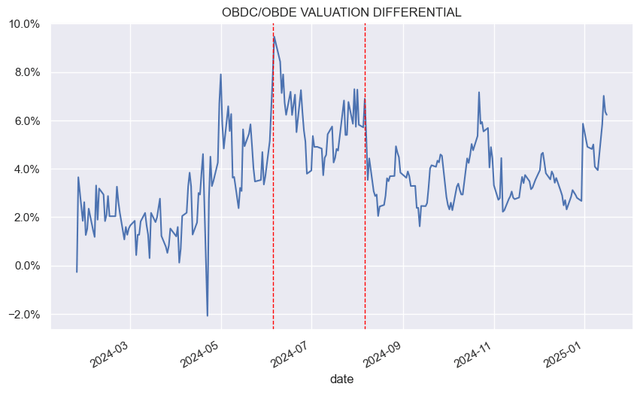
One example of these special situations is fund mergers. A good example was recently on offer in the Blue Owl BDCs OBDC and OBDE. The merger was done NAV for NAV and because the two BDCs traded at different valuations (OBDE traded at a much wider discount) OBDE offered significant upside into the merger. We reallocated to OBDE from OBDC on the illustrated dates as shown below. This resulted in about 6% of additional alpha over half a year or a double-digit annualized return on top of the double-digit dividend yield of the BDC.
Another special situation is regular tender offers. We keep track of these on the service along with the alpha which often reaches mid single-digits. We continue to like funds like the Muni CEF EIM and Hybrid CEF ZTR which are good holdings for investors who already have positions in the sector.
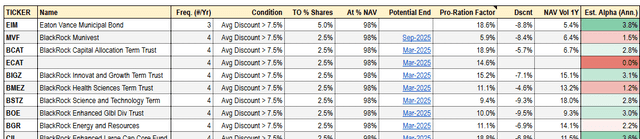
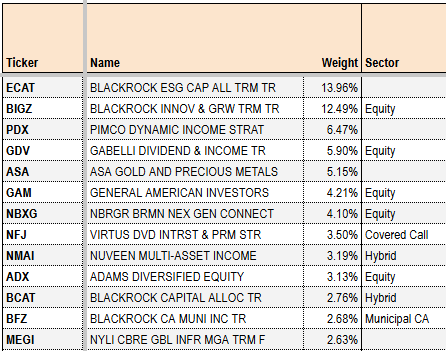
Activist holdings also offer potential upside, particularly those from the very aggressive outfit Saba. Their ETF CEFS is a good window on where they are spending most of their energy. Most recently, they had a big win in BIGZ (2nd largest position) and BMEZ (24th largest position) where BlackRock agreed to run a tender offer for 50% and 40%, respectively, of the outstanding shares of the funds. PDX (2nd largest position) has had a nice run as well due to its Venture Global holding with an 8% total return year-to-date.
Takeaways
Gradually increasing income generation is a goal of many investors. However, the more obvious strategies to make this happen can also be unsustainable and ultimately self-defeating. Sticking with sustainable income strategies such as those discussed in this article are more likely to allow investors to organically grow the income levels of their portfolios over time and meet their investment goals.
Check out more in-depth and timely commentary as well as Income Portfolios and interactive Investor Tools at our Premium service.
What you get with Systematic Income Premium:
Morning Notes - 4 days a week (ex-market holidays)
5 Interactive Investor Tools
4 Model Income Portfolios
Chat room
Direct Access to SI

ADS Analytics LLC / Systematic Income provides opinions regarding securities and other related topics on an impersonal basis; therefore no consideration is made towards your individual financial circumstances.
All content presented here is not to be regarded as investment advice or constitute a client / advisor relationship. It is for general informational purpose only.
Trading securities involves risk, so you must always use your own best judgment when trading securities. You assume the entire cost and risk of any trading you choose to undertake. You are completely responsible for making any investment decisions.